
Variable Rate Success. It’s All in the Zone.
It’s 2018 and the amount of technology available to growers is greater than ever before. There is a lot of talk about variable rate technology but I’m not sure as many growers are actually utilizing technology to implement variable rate on their farm as we think. Today, it’s time to get back to the basics on how to create variable rate zones (and why doing so is important) using both simple and advanced tools.
Why use variable rate in the first place?
The main reason is to be more efficient with our inputs. There is no reason to apply the same amount of fertilizer to a poor producing wet spot as a high producing, well-drained part of a field. Instead, reduce inputs to poor areas and redistribute those inputs to higher producing areas by applying more fertilizer. Essentially, this tactic allows growers to apply the same amount of input with an increased return.
What do you need to create a variable rate map?
In order to create a variable rate prescription map, specific software is needed. Some of the better known computer-based software options are Ag Leader’s SMS, SST, Ag Data Mapping Solution, Climate Field View, and many others. Some are very powerful and allow you to bring multiple layers of data together to create common zones within your field, while others take a quicker, hands-on approach by drawing zones manually.
More importantly than choosing software, in my opinion, is to find out which layers of information are most beneficial when developing zones in your fields. Below is a list of what layers I believe are the most valuable:
- Yield Maps (multiple years)
- Elevation Maps
- Bare Soil Images
- Vegetative Maps
- Soil SSURGO Maps (Soil Survey Geographic Database)
Yield Maps
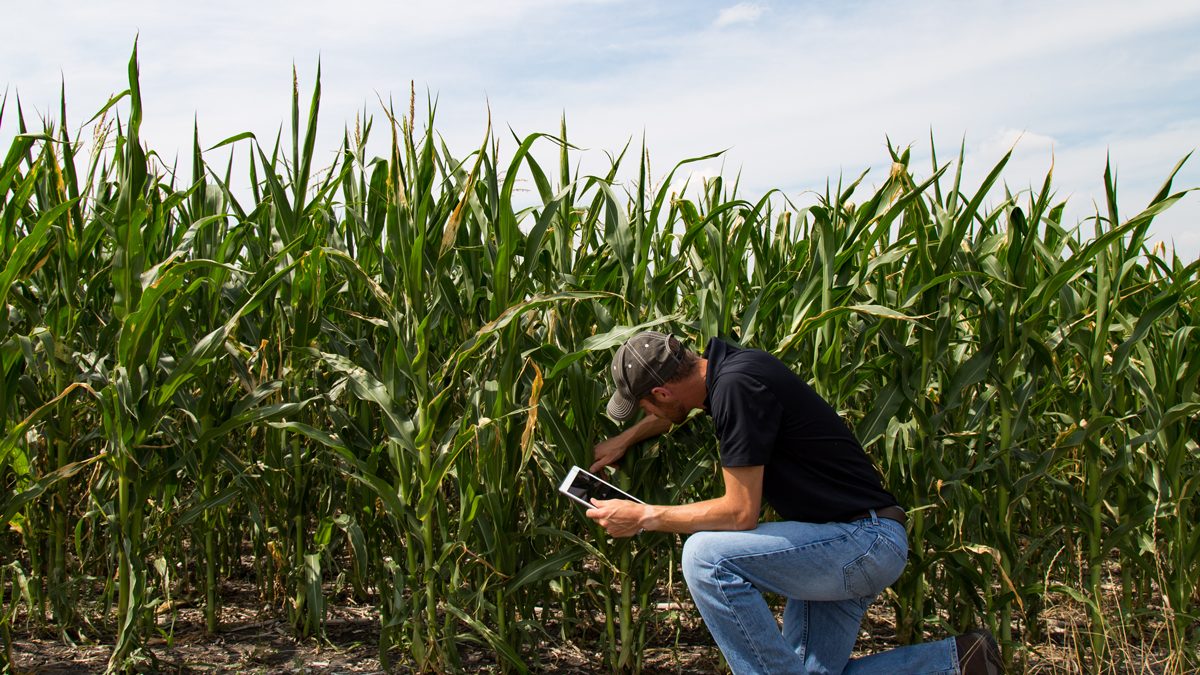
Yield maps are a great place to start especially if you have multiple years of the same crop. Single-year data may depend too much on the weather of that particular year, so long-term data is more helpful when determining the yield potential and trends in your field.
Yield map showing year over year yield data.
Elevation Maps
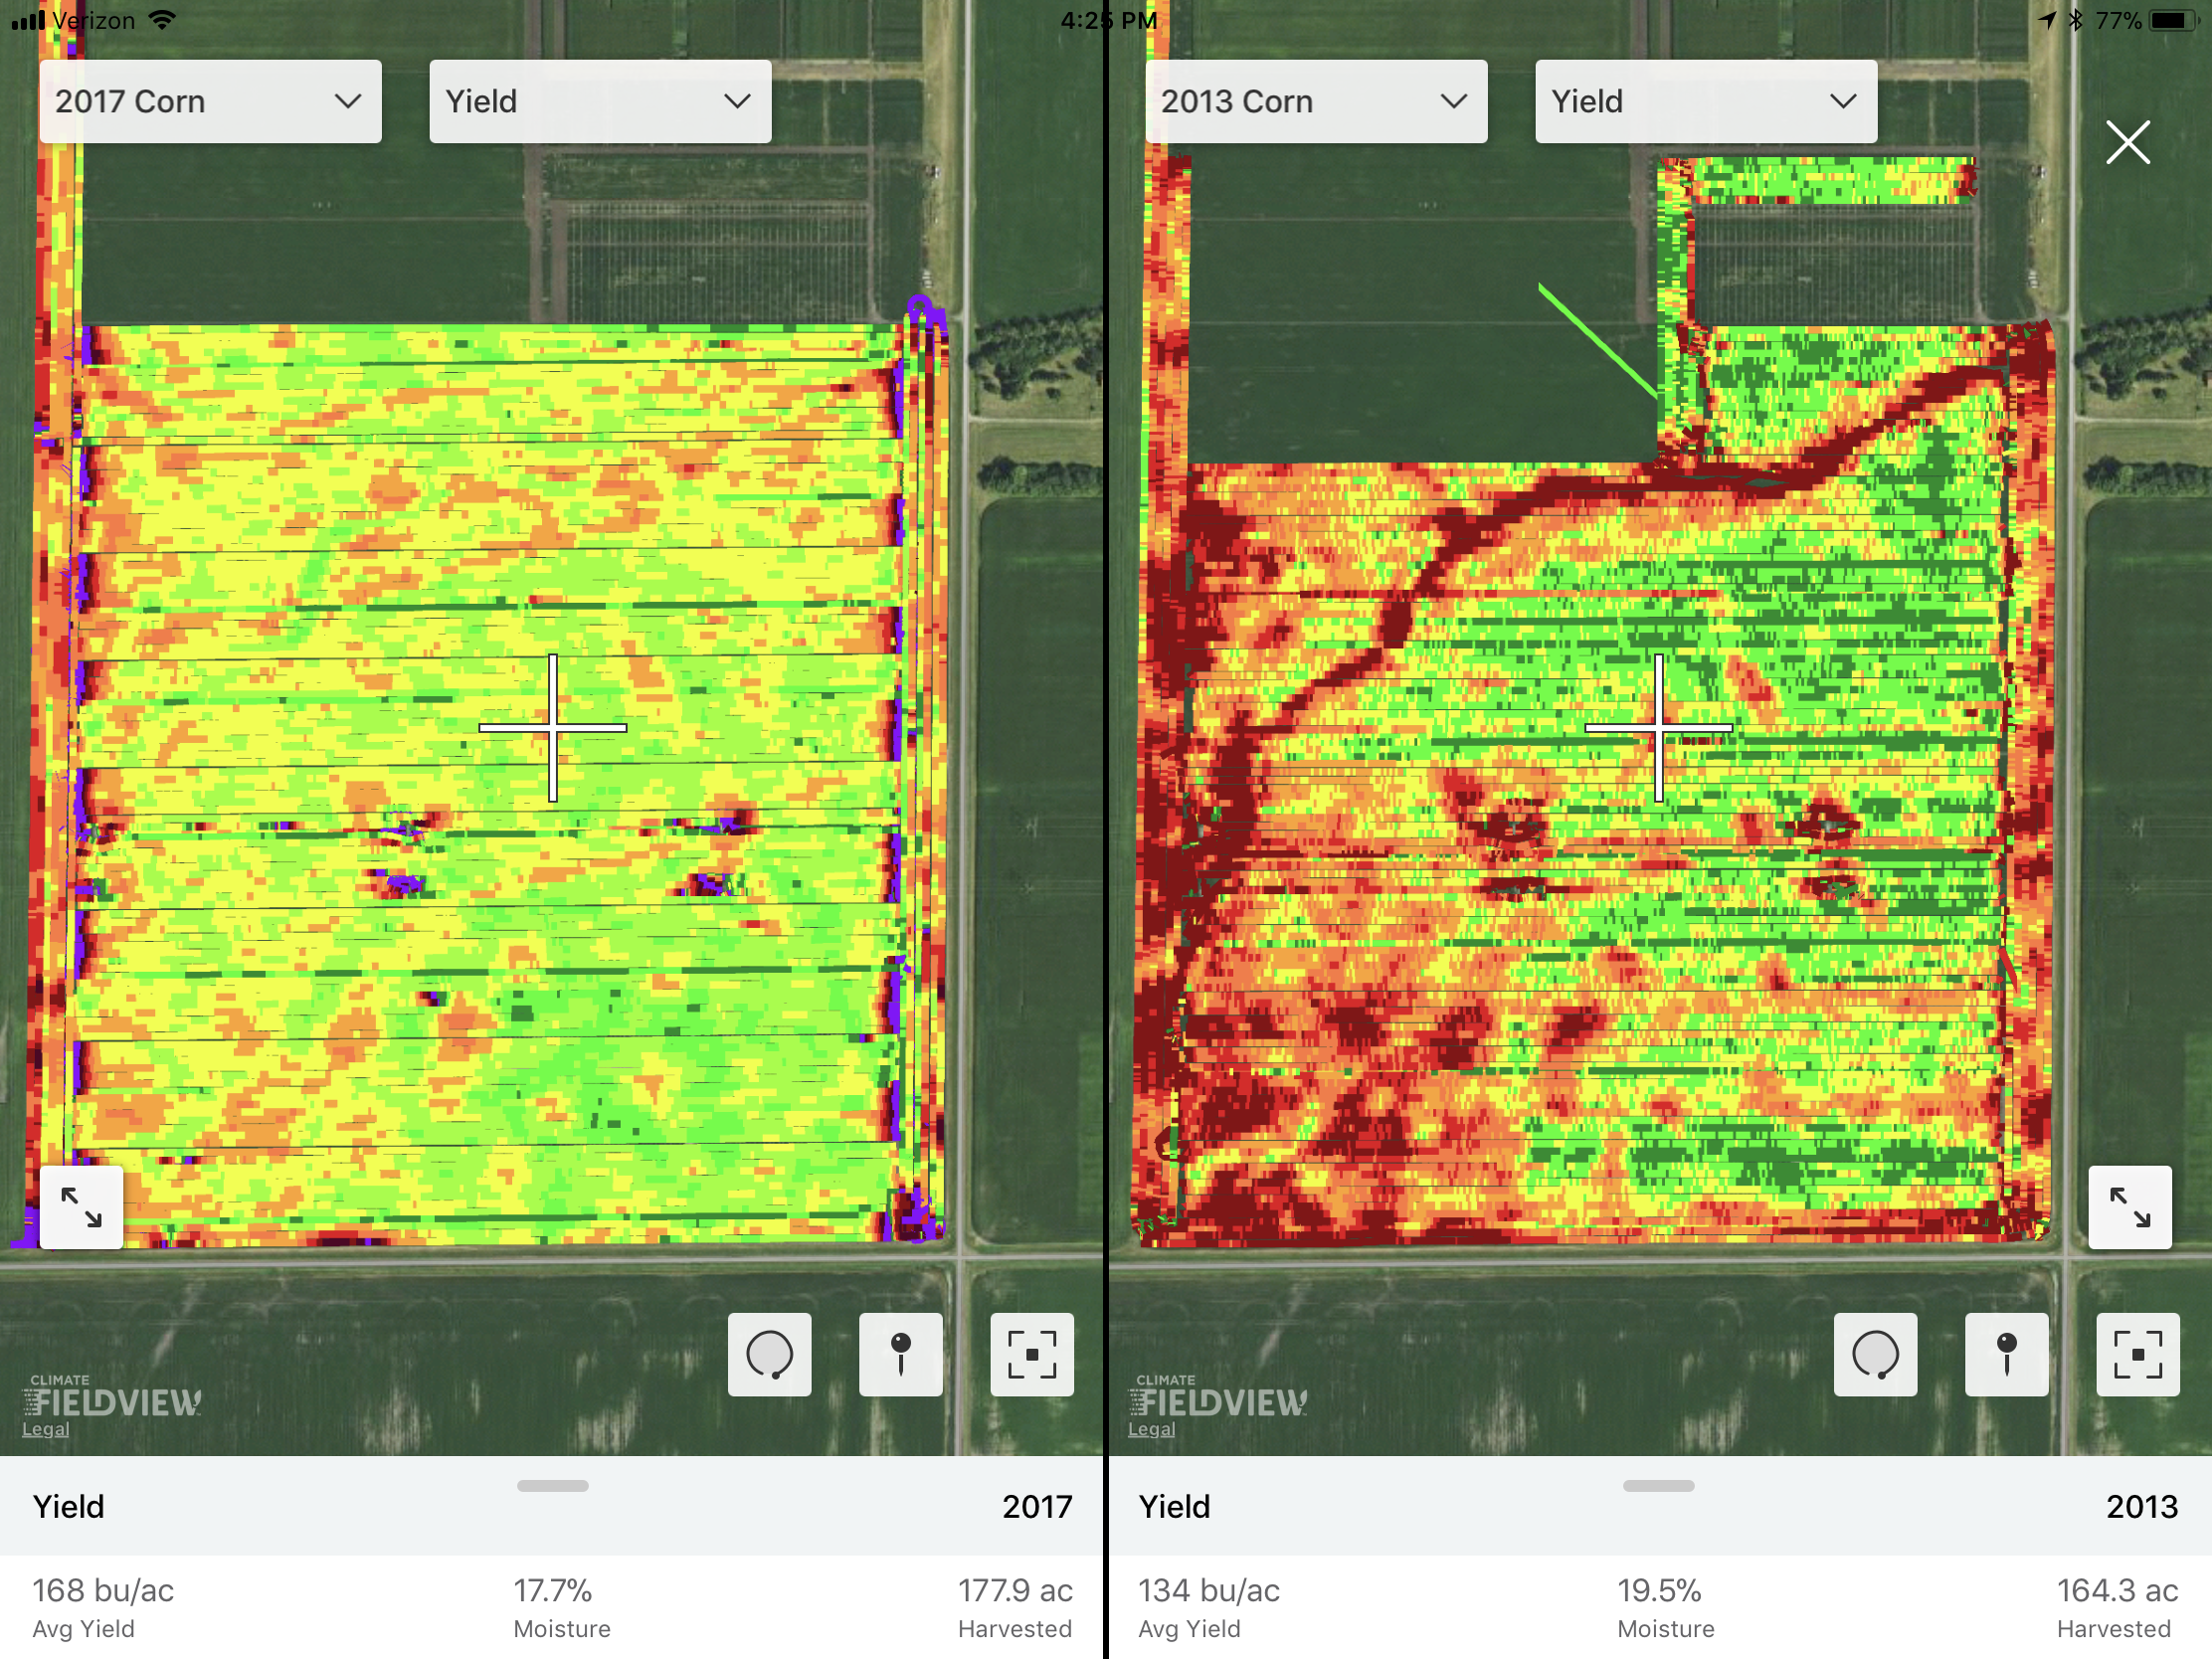
Elevation maps come from the planter, the combine, publicly available LIDAR maps, or even from drones. Elevation maps are great because, in many ways, they show the water movement of your field and usually correlate to the previously mentioned yield map.
Combining an elevation and yield map from the same field can show water movement and its correlation to yield.
Bare Soil Maps & Soil SSURGO Maps
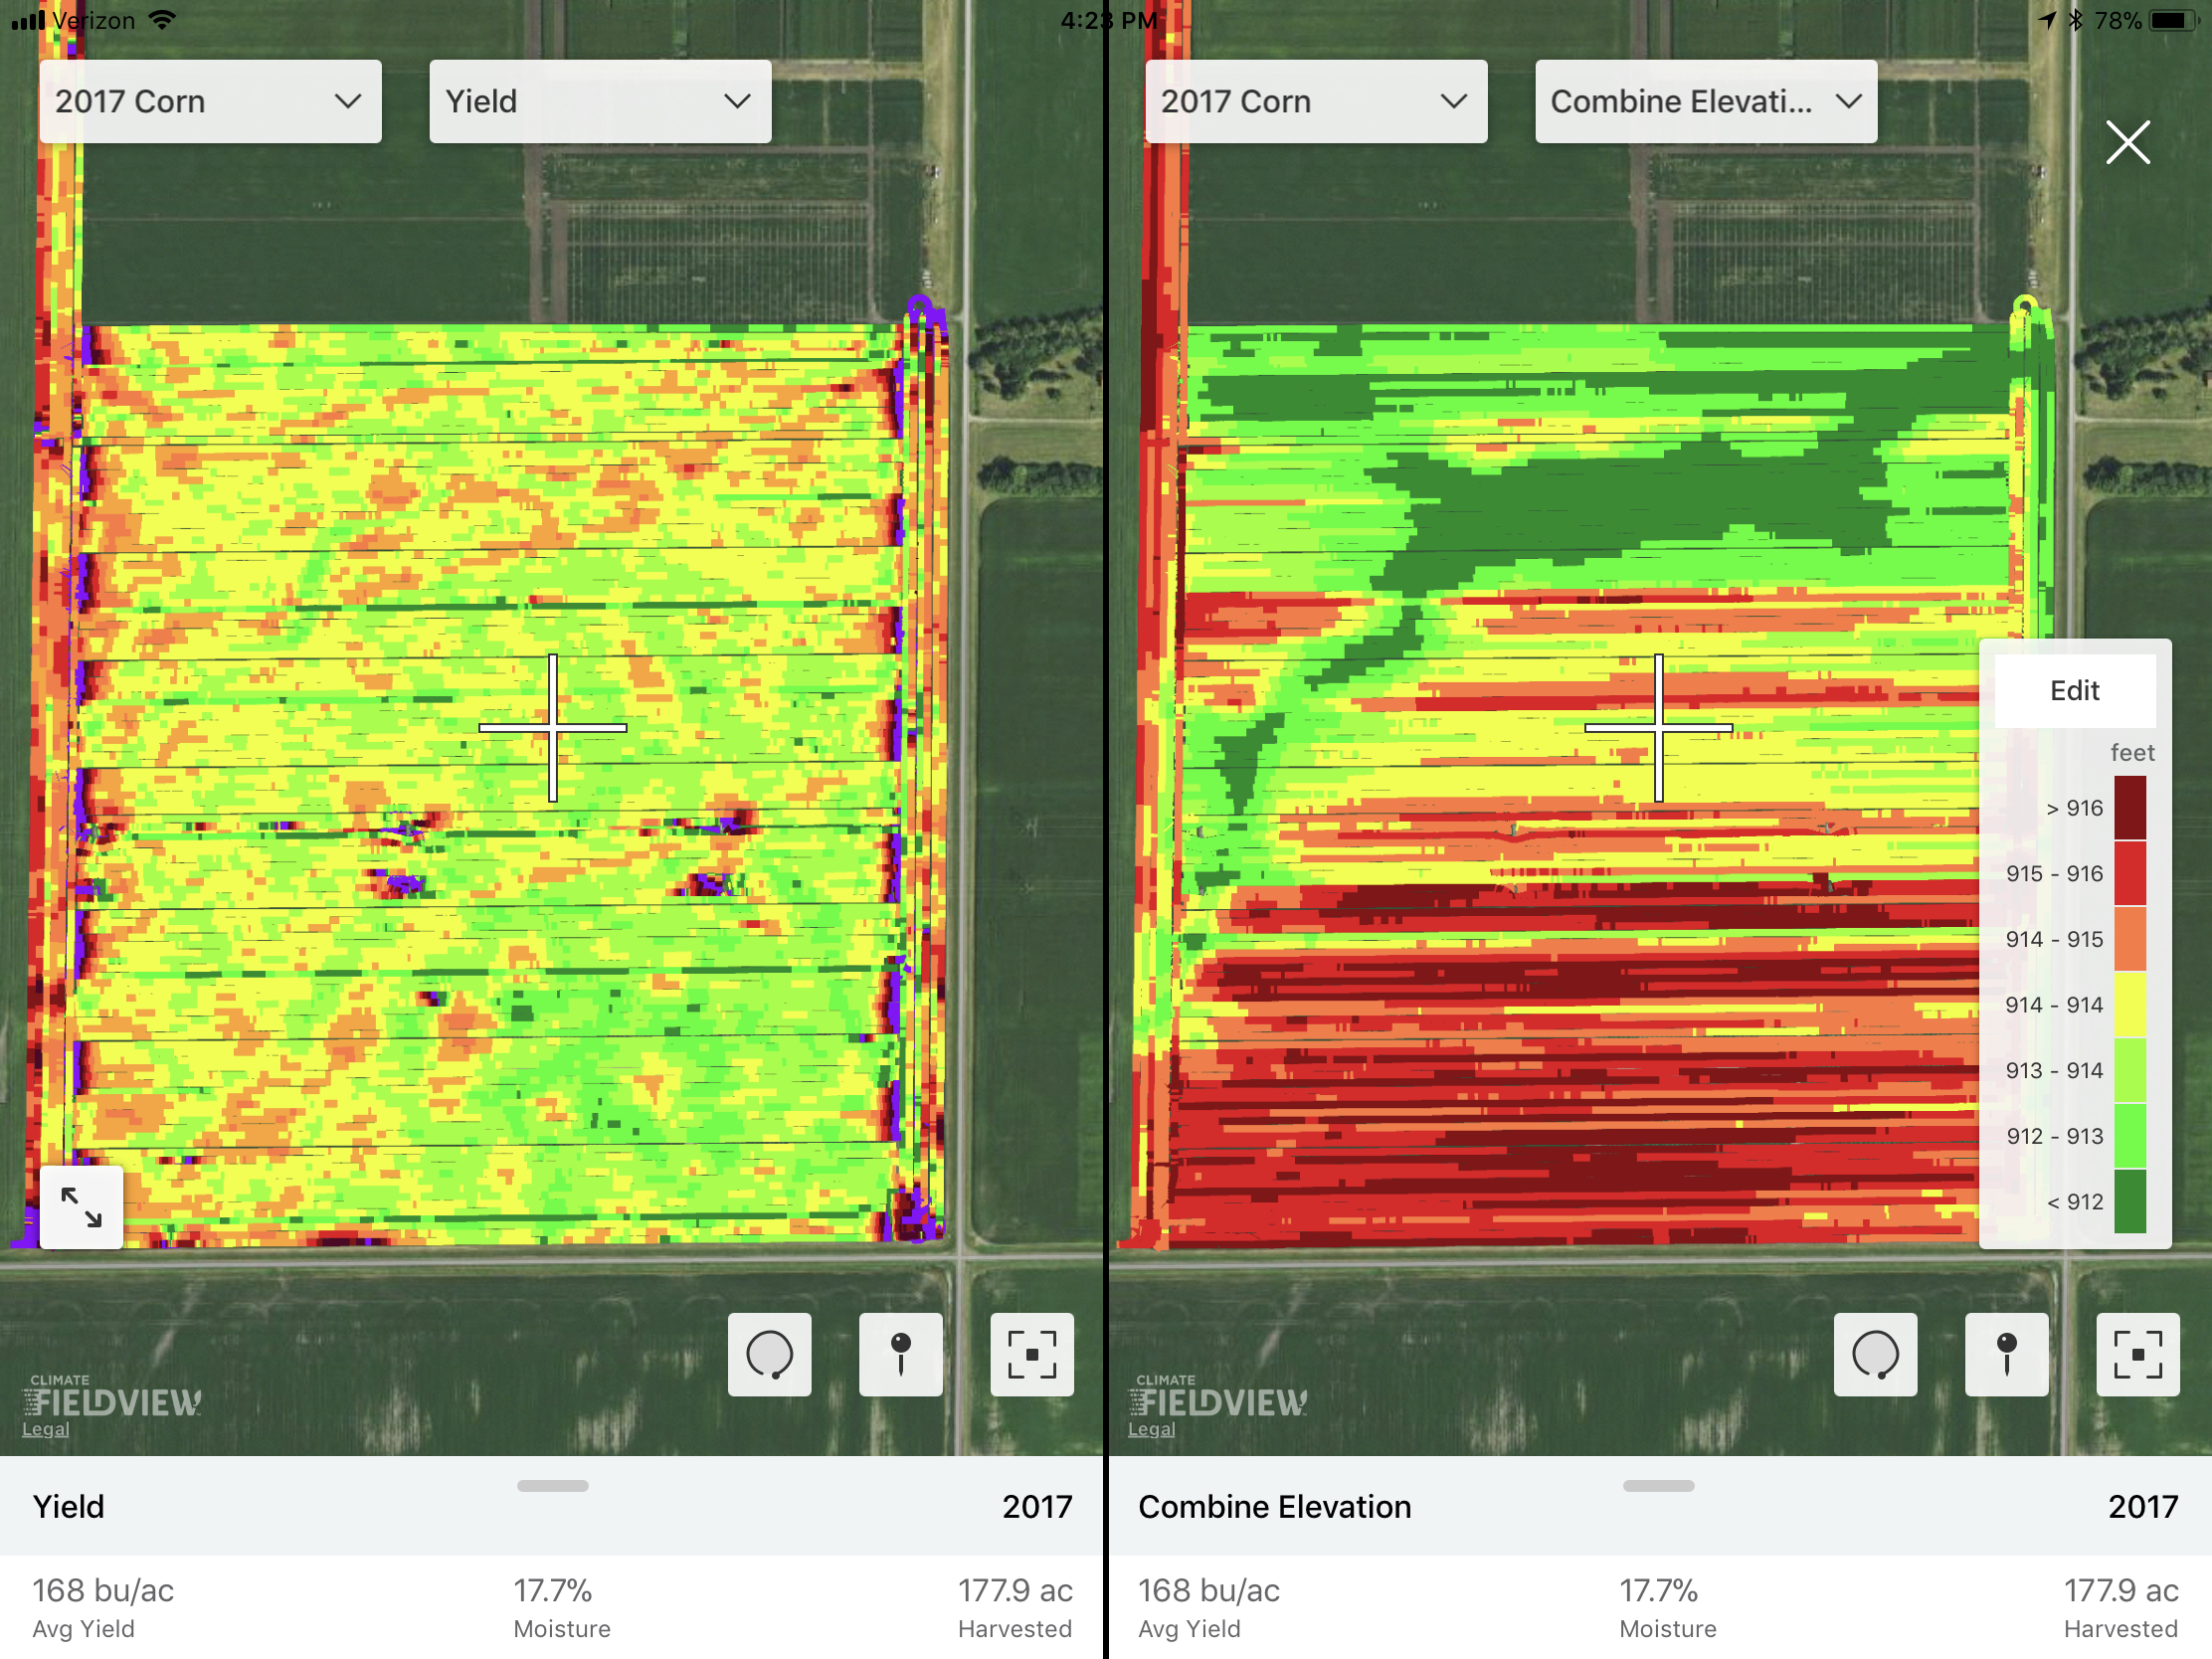
A bare soil map from either a satellite or drone provides a great view of the different soil textures of your fields. There are the SSUGO maps but I have found that in most areas they are not highly accurate to individual fields, so I would depend on the information from a drone or satellite image as more accurate.
SSURGO (left) shows less variation than the satellite bare soil map (right).
Vegetative Maps
Lastly, vegetative maps from satellites and drones provide a great layer to show high and low producing areas of the field. These can be color maps or NDVI maps. I have found that these maps highly correlate to yield maps, especially during early July.
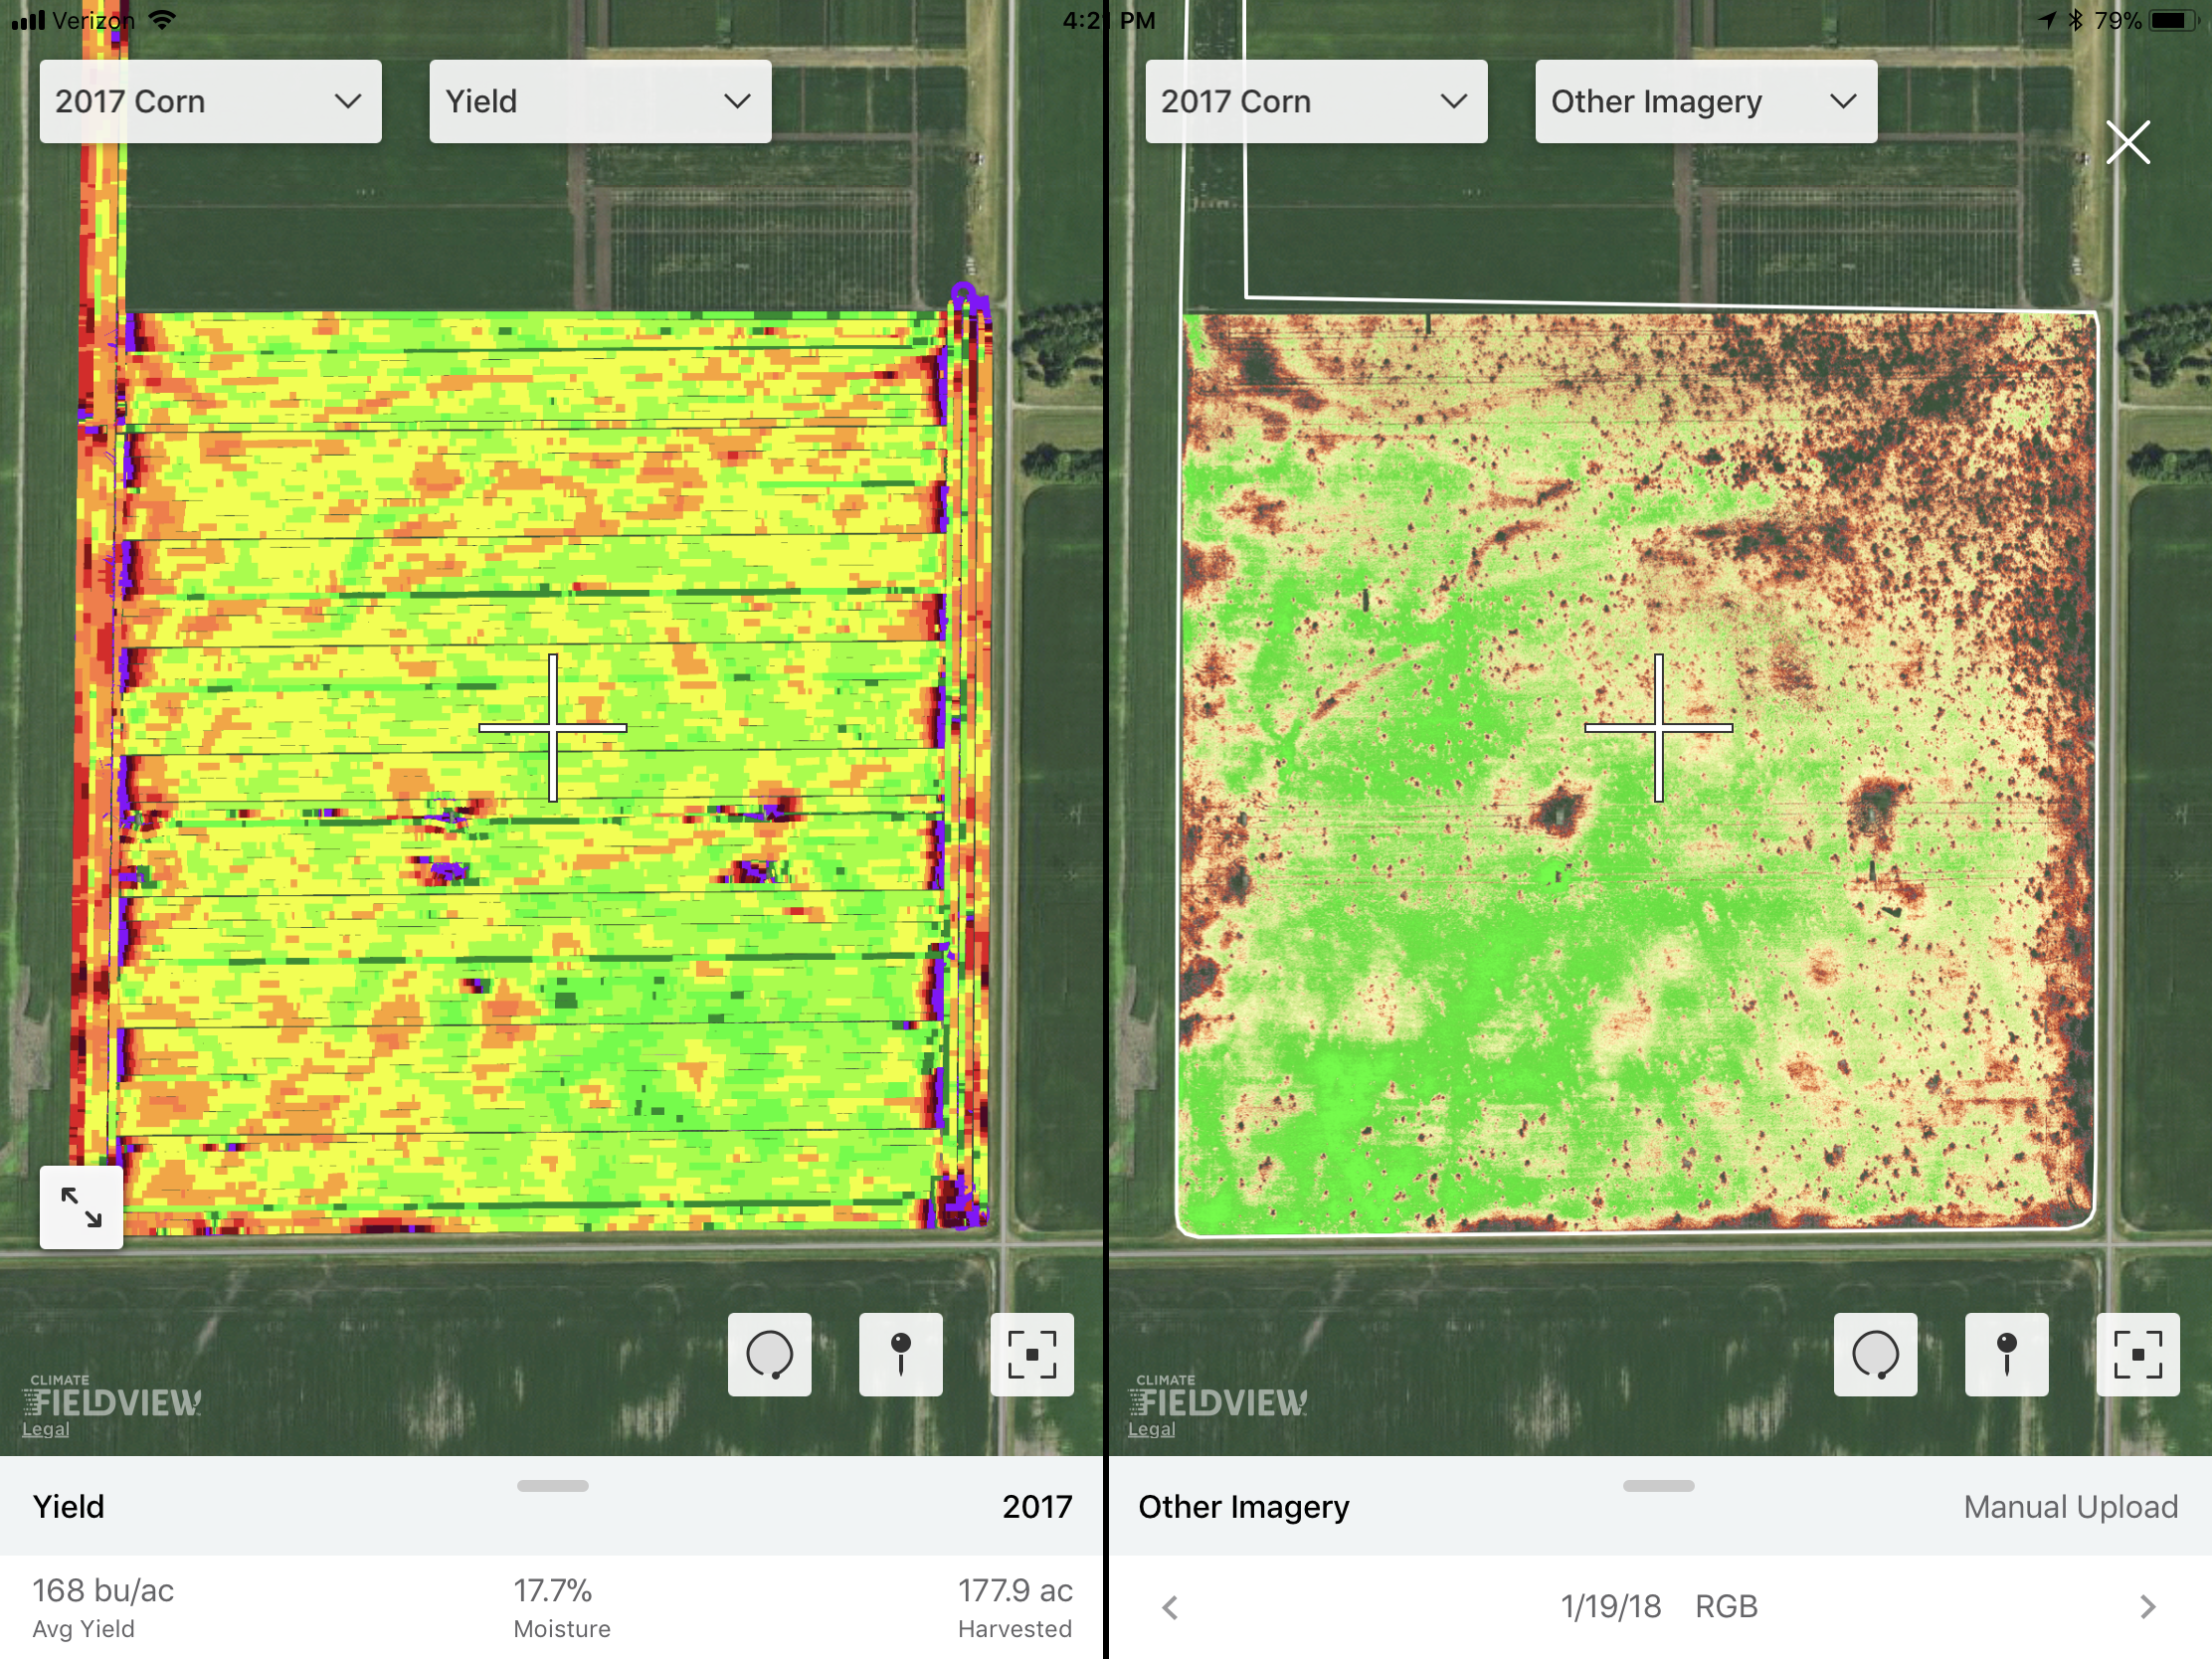
Comparing a yield map (left) to a vegetative map (right).
Combining maps into a single view
Some software platforms have the ability to use all of the layers I’ve covered to come up with common areas of difference and create zones. Others offer the ability to lay these maps in the background while you hand-draw your own zones over the top. While both ways work, it will mostly come down to how much time you want to spend on each field to determine which software version will suit your needs best.
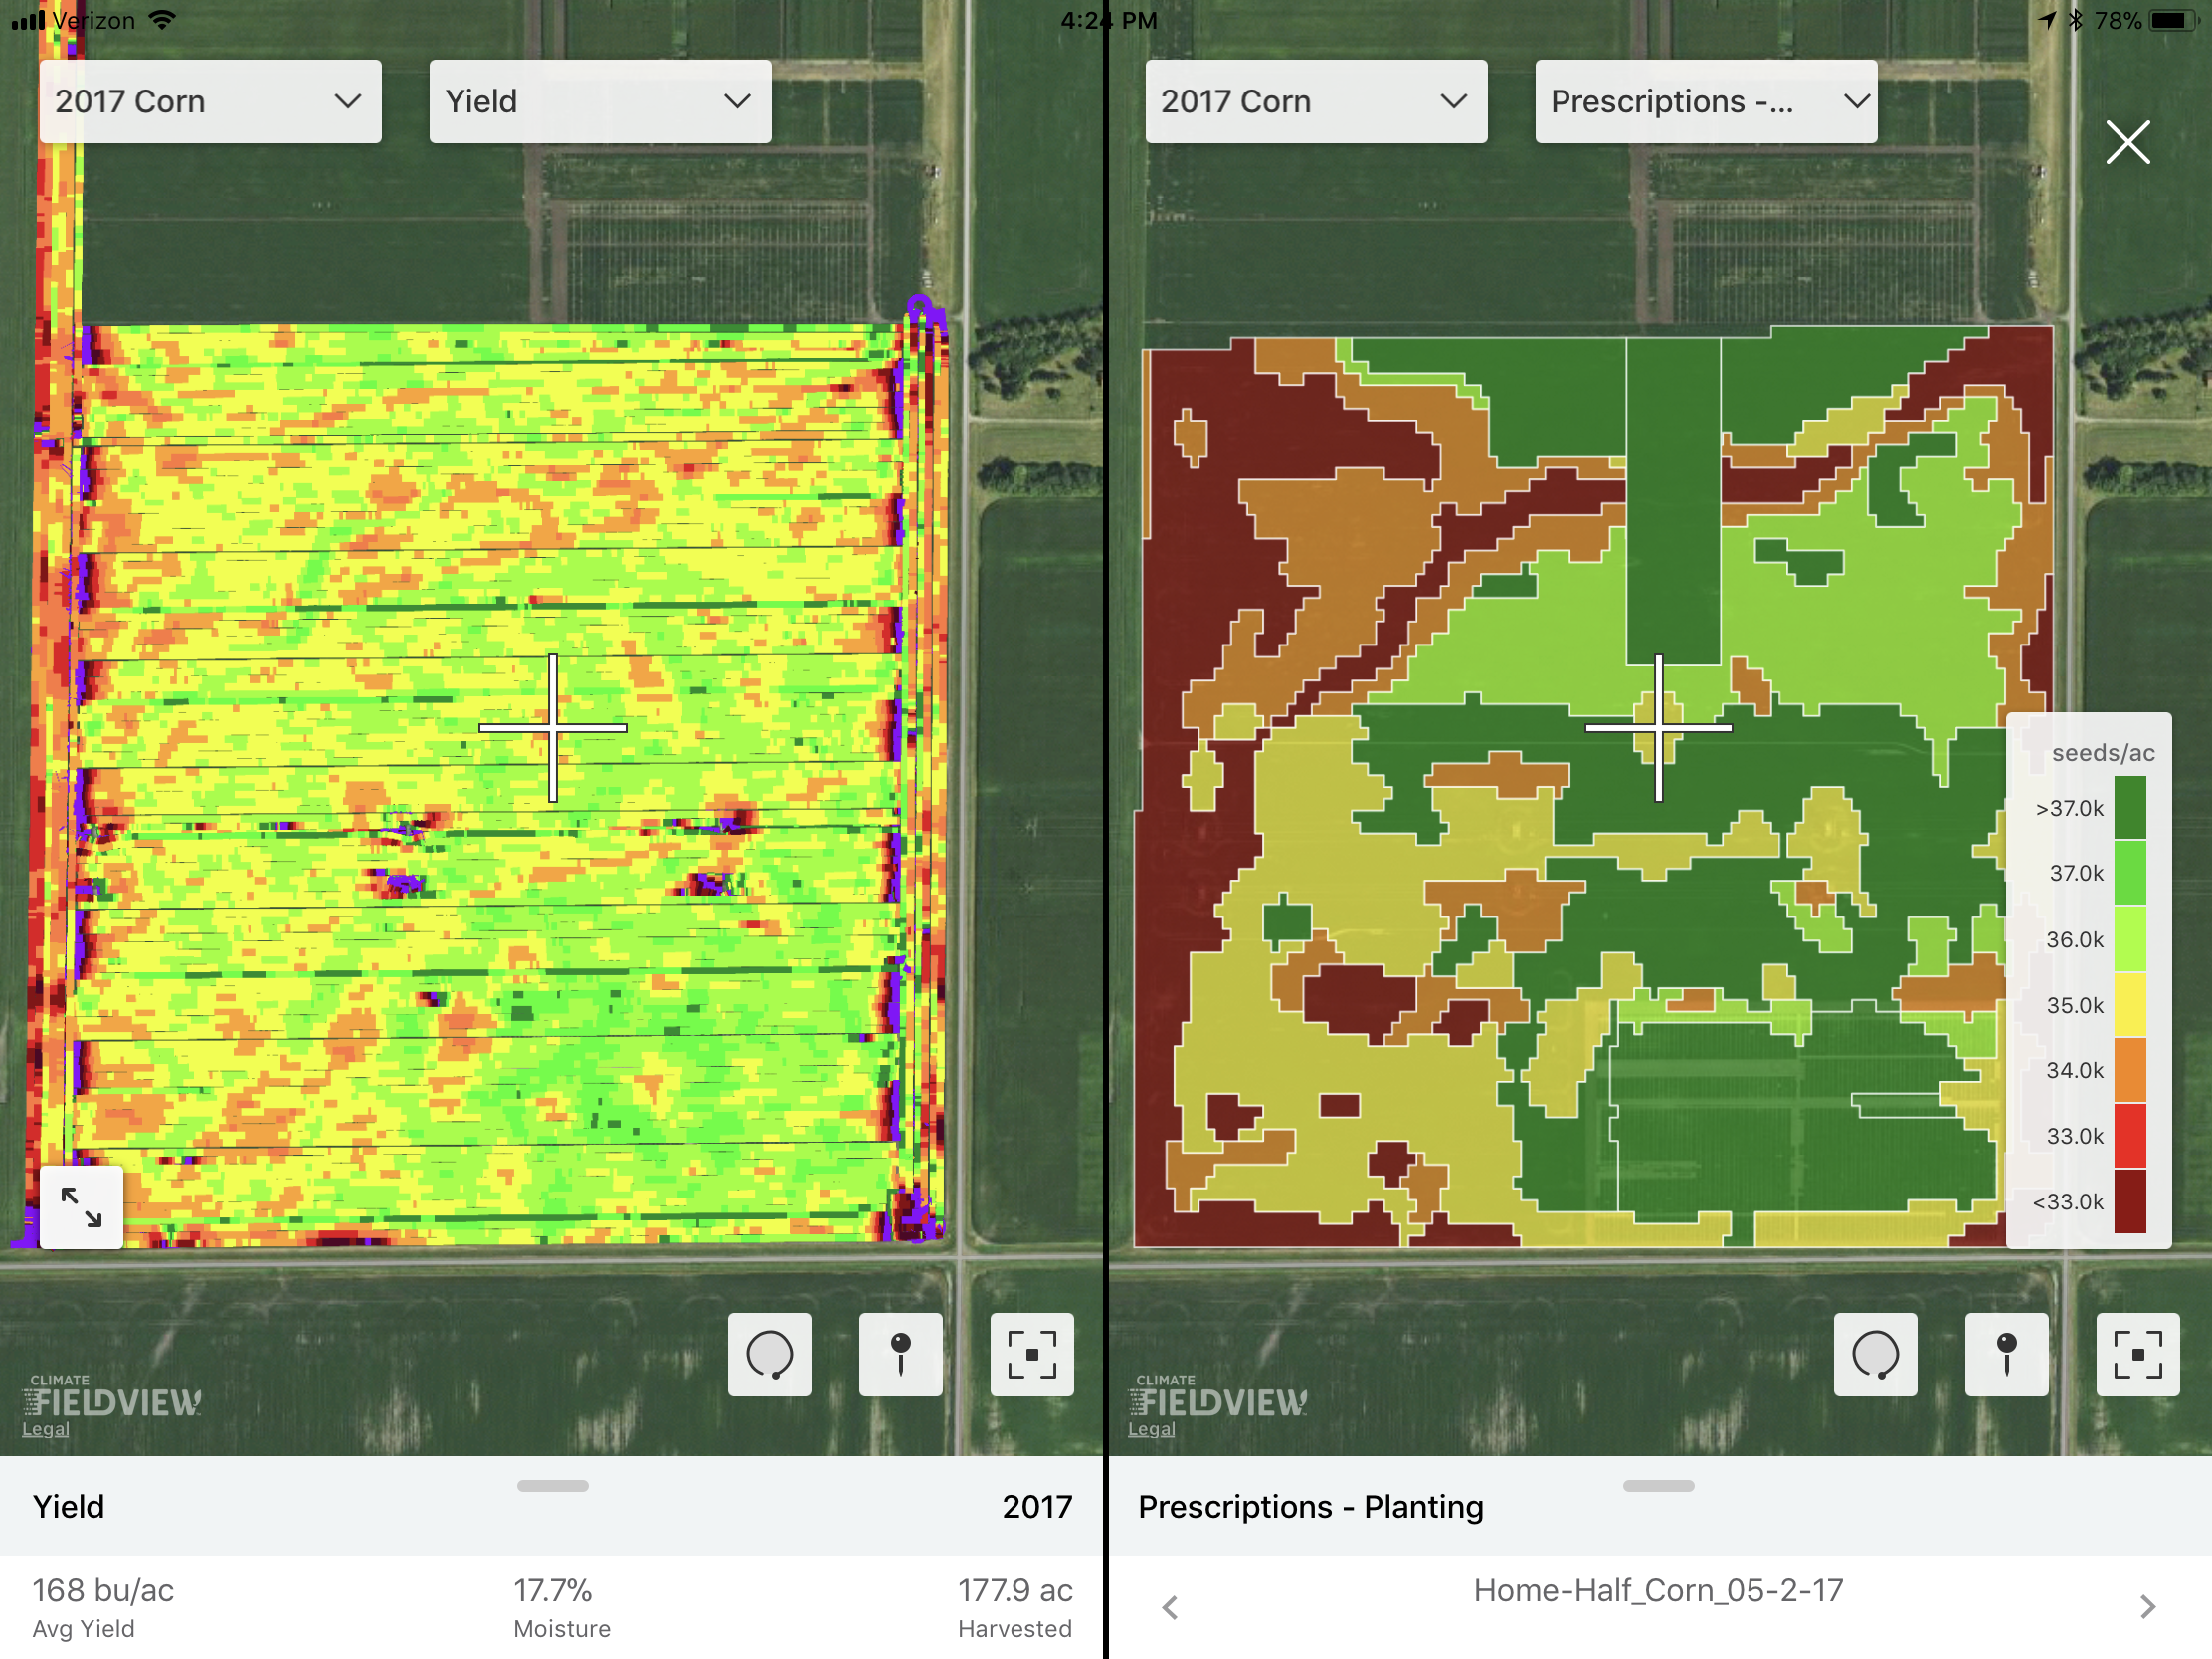
All of the maps can be combined to create a layered map to help make decisions and see results on your fields.
Now that you’ve got a better idea on the type of software and layers available, keep an eye out for the next post in this series! Coming up, I’ll cover how to come up with the different rates used in each zone you’ve created and how to use check strips to check your efficiency.
If you’ve got questions about how you can best use technology on your farm, drop me a line at nolan@petersonfarmsseed.com or give me a call at (866) 481-7333.


