
We’ll Track GDU for You – Delivered to Your Inbox Every Tuesday!

For the past 14 years I’ve run custom GDU reports for our region and it has changed the way I gauge how a year is going. It also provides a good record to help define what “normal” really is.
I’ve heard of this report (we’re calling it Swenson’s Weekly Snapshot) being used for everything from measuring crop progress to estimating propane demand in the coming months.
Each year, I start graphing progress the week most operations begin to plant corn. This year I started the week of 4/26.
At the top of each region/town you will find current GDU count for the year and the previous year. In 2020, many places didn’t plant until 5/10 hence the “0”. The bottom of the page has a graph showing departure from normal. This does an excellent job of showing above and below average progress throughout the season.
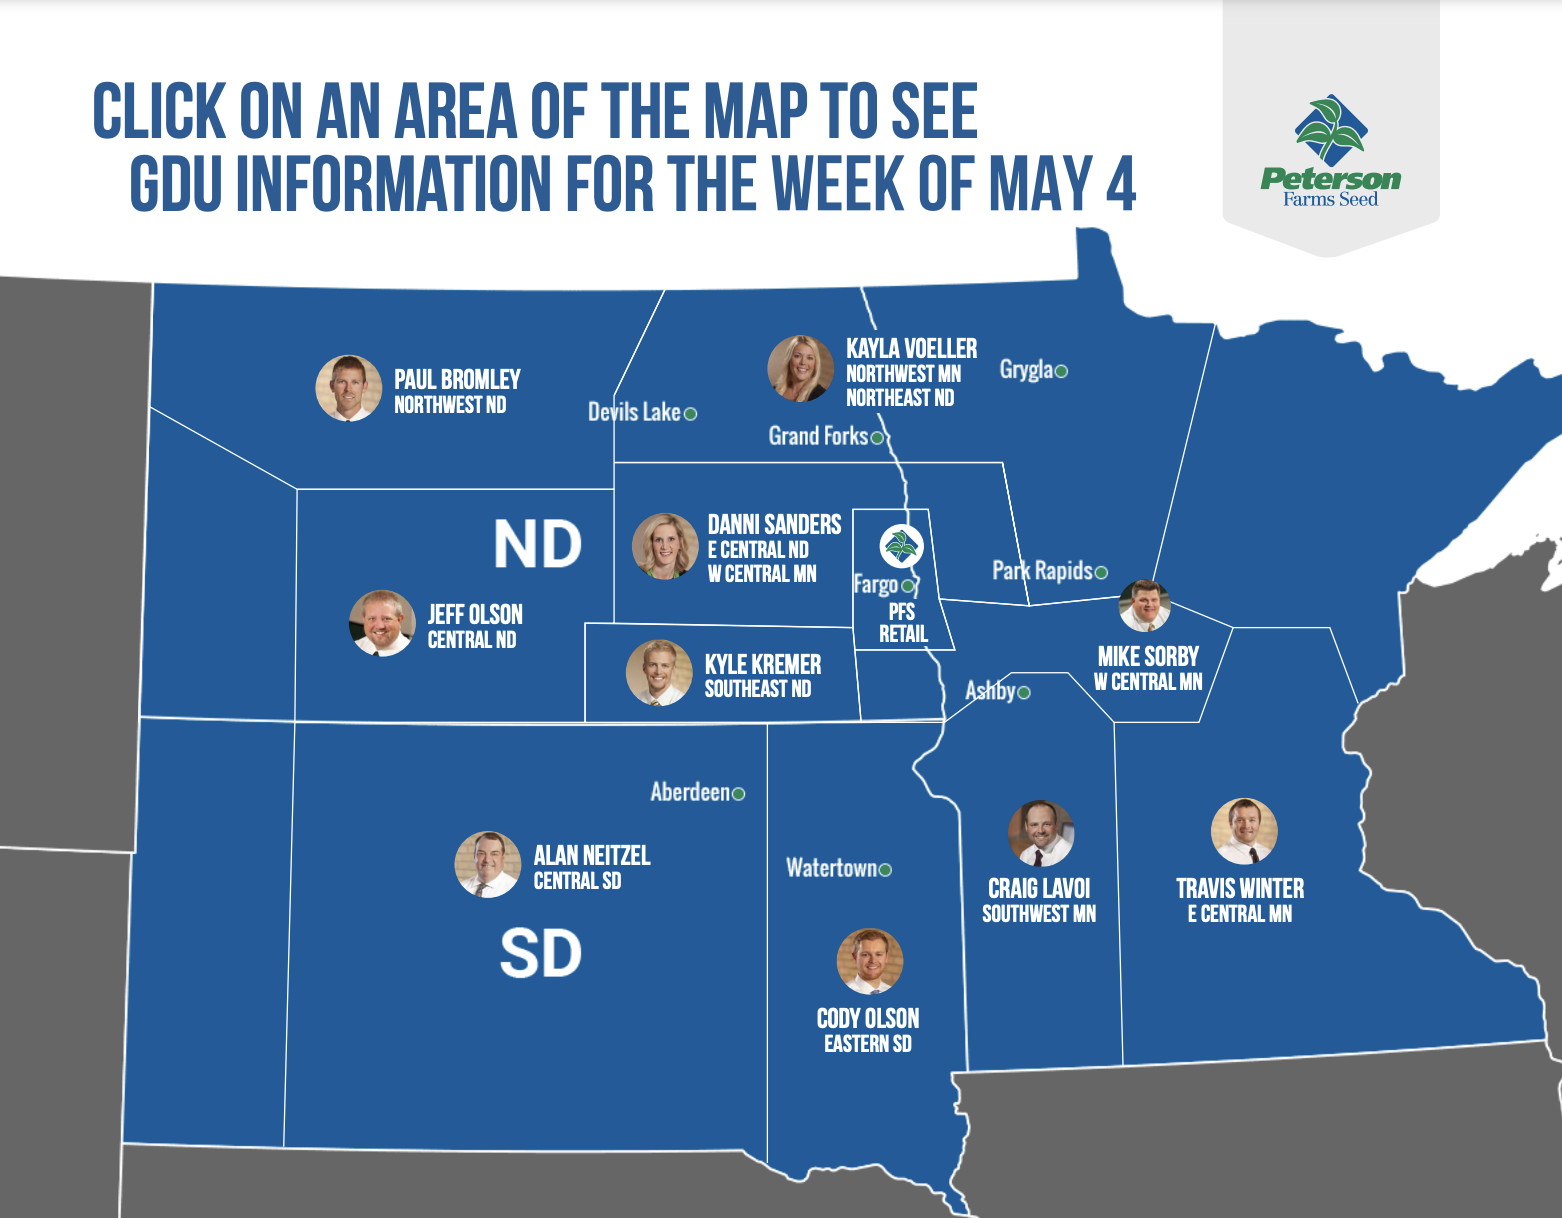
For each map, I collect reports from our Territory Managers on how the year is rolling along! I hope you find them as helpful as I do.


